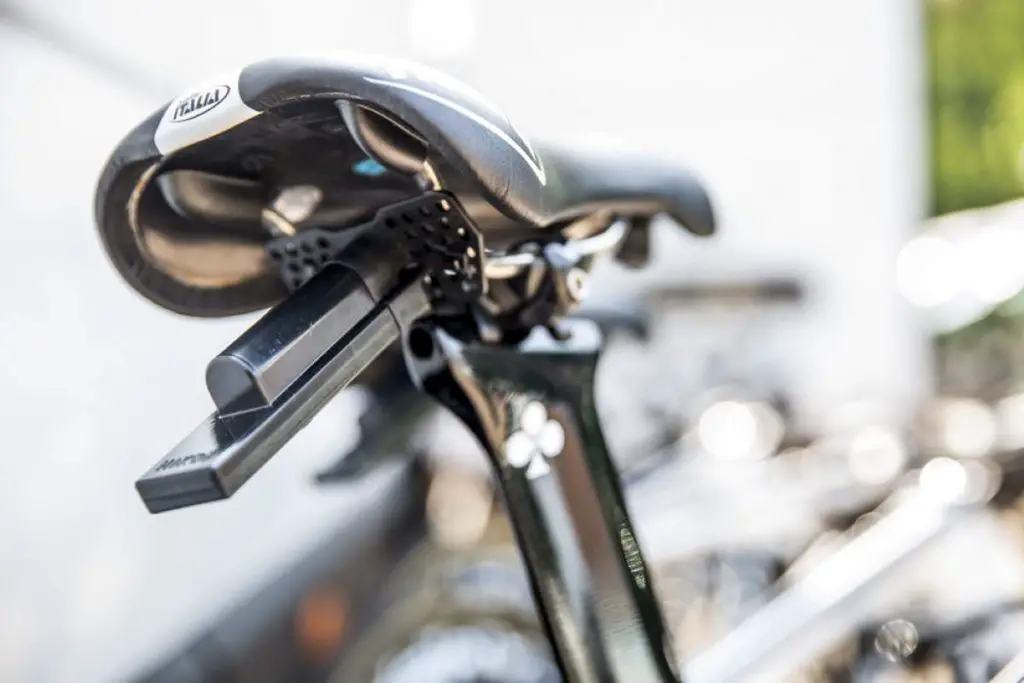
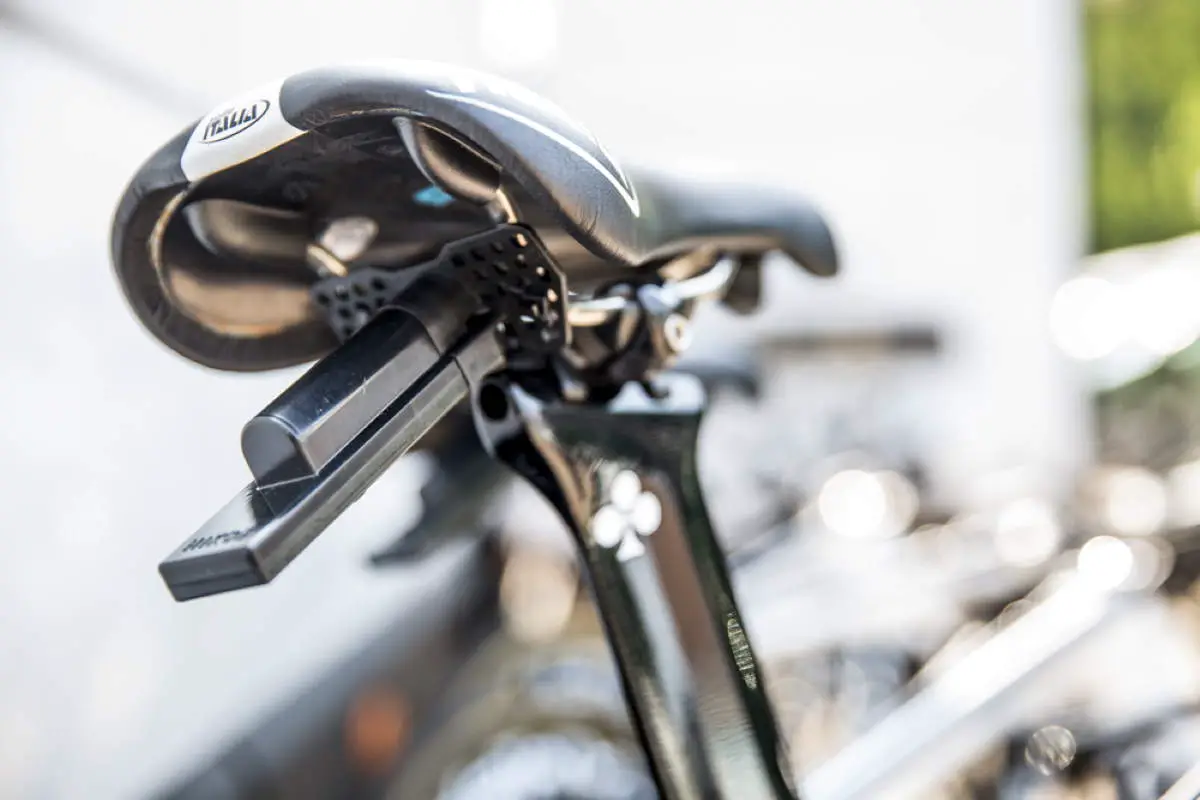
A lot of people are wondering what is the black stick below the riders’ saddles at the Tour de France. Well, it’s a real-time data transmitter. It is provided by Dimension Data, a South African company specializing in information technology services, and officially called the “Fox”.
The black stick vs boxed magnetic timing chip
From 2015, each rider has a GPS transponder allocated to them, attached behind the saddle. These ‘fox tails’ are used by every rider, during every stage of the Tour de France. Data recorded is streamed live to the organizers and TV companies, and is used to determine, amongst other stats,
- the stage winner’s top speed, average speed, and time per kilometer
- the fastest riders up key climbs
- the speed of the winner at the finish line
- the top speed achieved by a rider on the day
- average speed across all riders.
If a rider changes the bike during a stage, the team must notify the organizers because the transponder probably will not be transferred to a replacement as that would take too much time.
Previously, a boxed magnetic timing chip (placed exactly 1.2m behind the lead edge of the front tire) enabled the verification and scoring of each rider’s arrival at a stage’s finish. However, the box could cause problems when changing a rear wheel.
Dimension Data is privileged to partner with the Amaury Sport Organisation (ASO) to revolutionize the viewing experience of billions of cycling fans. As the Official Technology Partner of the Tour de France, we’ll provide real-time data analytics on each of the riders – a world-first for cycling.

The data provided by the “black stick”
With that little device, we can see the live speed of the riders and many other statistics like time gaps.
Today, Dimension Data has released a summary of this year’s Tour de France analytics (the first 11 stages). Some highlights are:
- The highest speed in the first 11 stages was 109.08 km/h by Lars Boom (Astana) during the 3rd at the 144 km mark. This was followed by 93.38 km/h by Alejandro Valverde (Movistar) at the 149 km mark at the 11th stage; 78.48 km/h by André Greipel (Lotto-Soudal) on the 5th stage at 89.4 km; and John Degenkolb (Giant-Alpecin) at the 5th stage at 89 km; with Nicolas Roche at 78.37 km/h during the ninth at 16 km.
- The highest average speed achieved by a stage winner was 55.45 km/h (Rohan Dennis on stage one, it was also the fastest time trial victory in the Tour de France history), while the average speed across all riders for the first 11 stages was 42.46 km/h.
- If we exclude the time trial, the highest average speed achieved by a stage winner was 47.64 km/h at stage two, the winner was André Greipel (Lotto-Soudal).
- The slowest average speed achieved by a stage winner was at the mountainous stage 11. Rafał Majka’s (Tinkoff-Saxo) average speed was 37.35 km/h.
- The analysis of riders’ speed through a Feed Zone shows that on average, riders slowdown 20 km/h when picking up musette bags.

Dimension Data analyzes over 150 million data points at each stage of the race. From the transmitter to nearby motorized vehicles (when necessary, motorbikes or other cars are used), the data stream is literally uploaded to overhead helicopters or fixed-wing aircraft equipped with receivers and transmitters. It’s all about getting good line-of-sight transmissions back to the data center, a big rolling truck that follows the race everywhere.
Sources
- Le Tour de France: cycling tactics and glossary on abelard.org
- “Tour de France Features Fast Cyclists, Faster Data” on whatsyourtech.ca
- BikesOnline Carlsbad: Your Premier Cycling Destination in San Diego County - June 15, 2025
- Top 19 fastest Paris-Roubaix editions - April 14, 2025
- Fausto Coppi in Africa [A Very Rare Photo] - January 4, 2025
